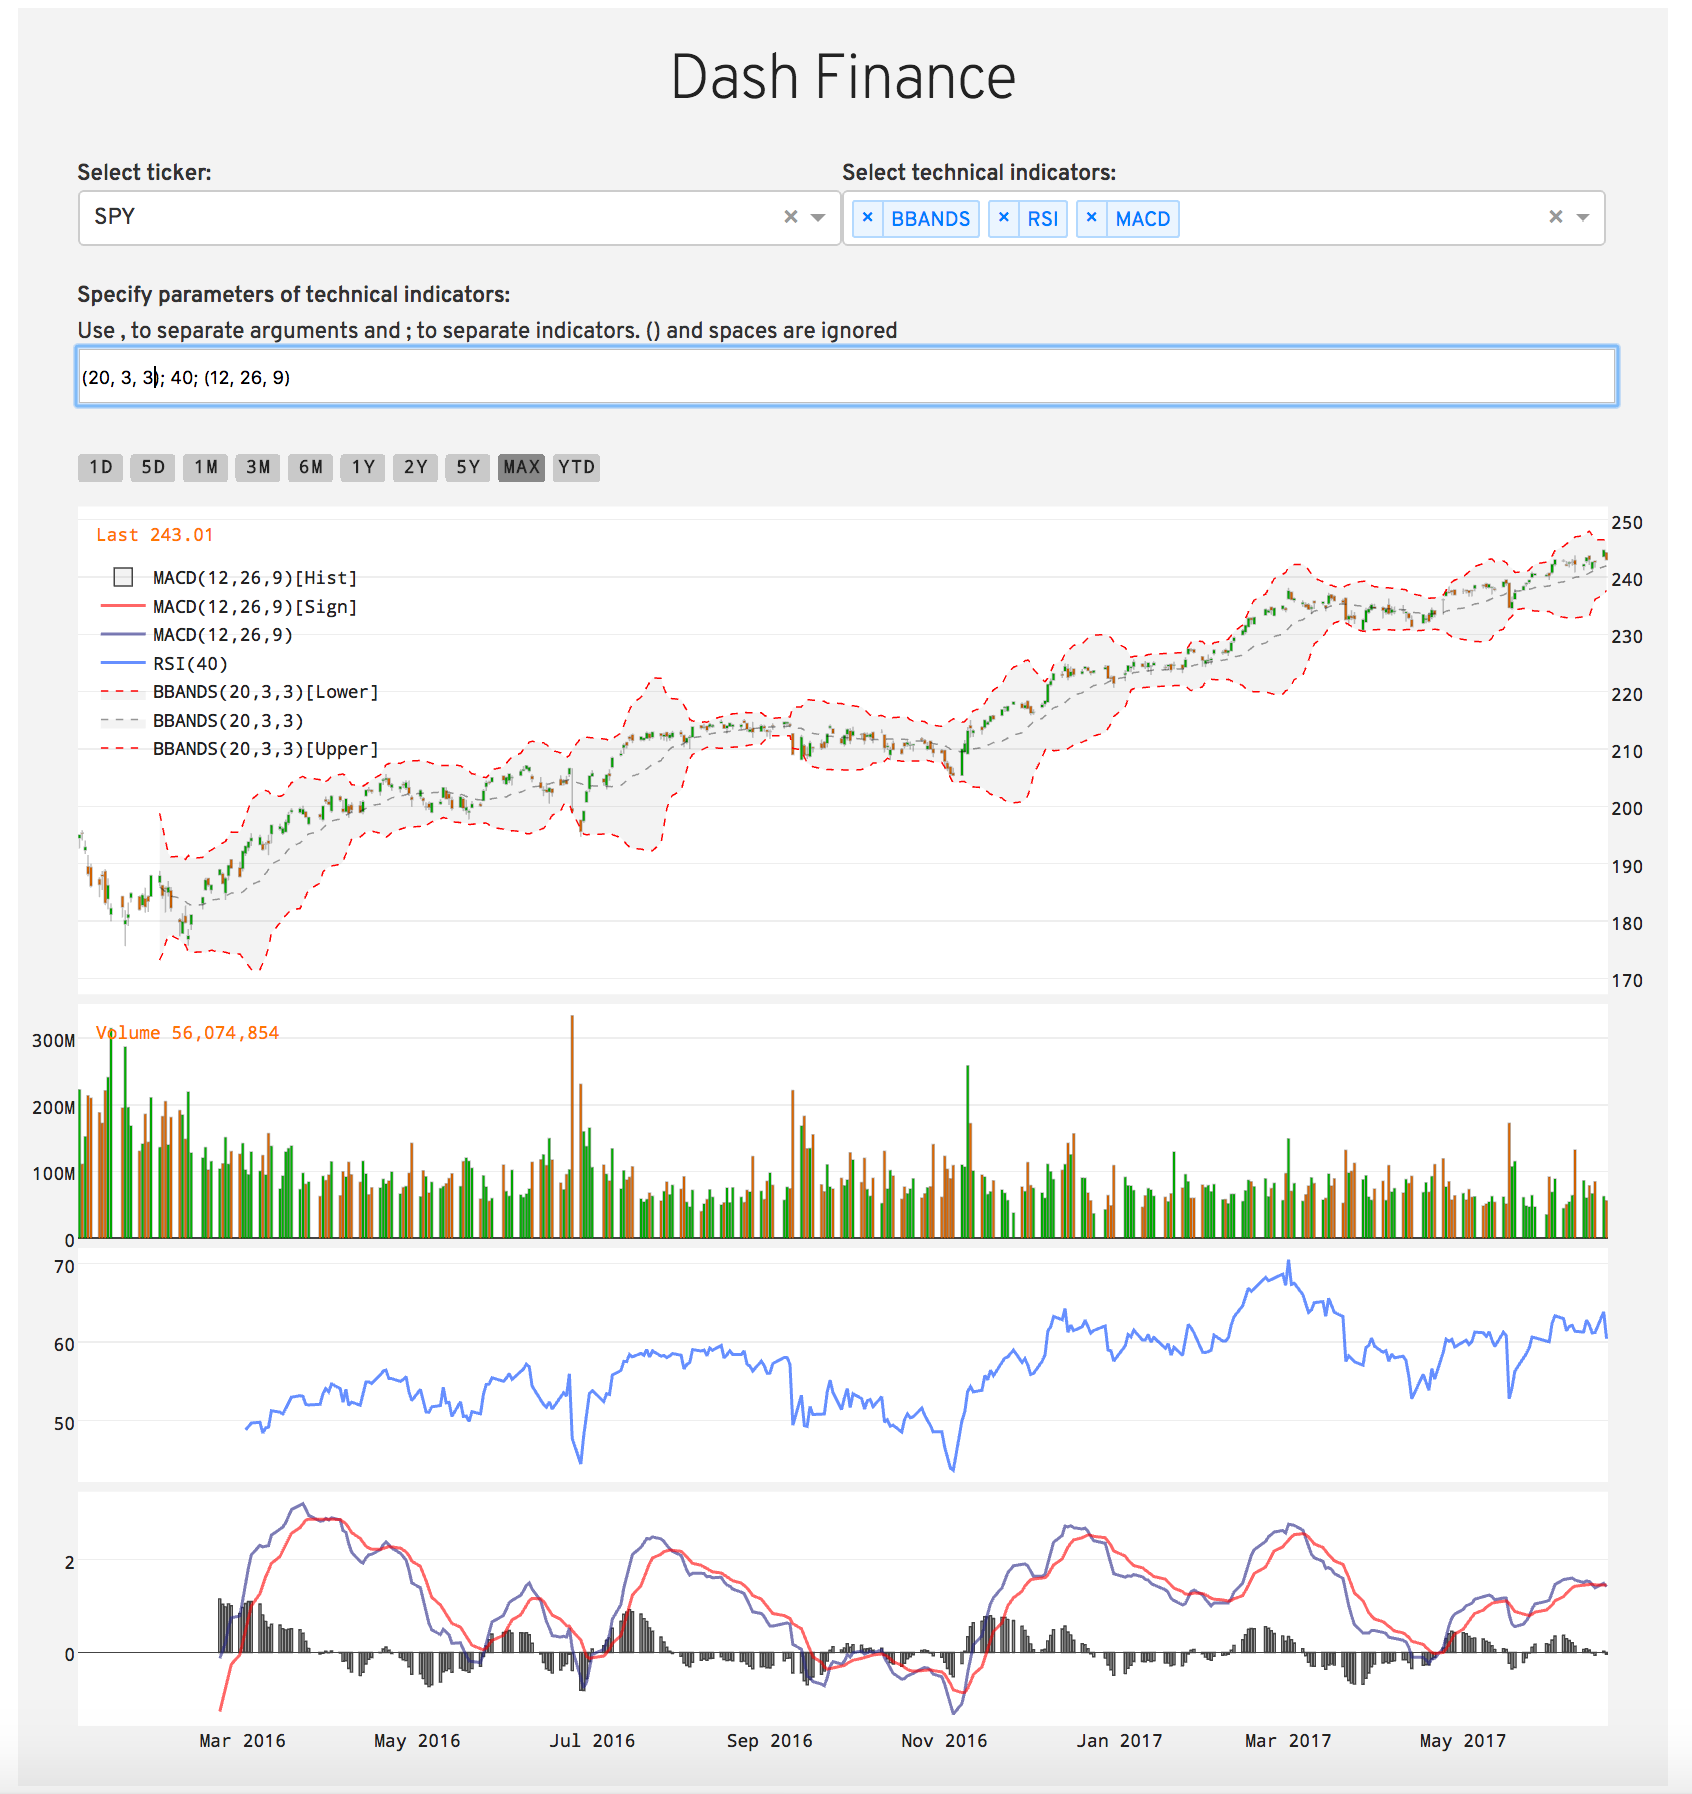
Dash Technical Charting App
This is a demo of the Dash interactive Python framework developed by Plotly.
Dash abstracts away all of the technologies and protocols required to build an interactive web-based application and is a simple and effective way to bind a user interface around your Python code.
This demo is very similar to the simple Stock Tickers App, but it dynamically binds py-Quantmod along with Ta-Lib to chart SP500 stocks and major ETFs with over 50 technical indicators, ranging from a simple moving average, to Stochastics, to more obscure indicators such as the Channel Commodity Index. It also makes use of caching to speed up app performance.
To learn more check out our documentation.
The following are screenshots for the app in this repo: